
Python is the most widely used high-level programming language. It is the simplicity that makes Python a favorite language with coders and data scientists. Non-programmers feel uncomfortable when they are asked to work on a programming language.
But I have a justification – do you know simple mathematical and logical functions of MS-Excel. If yes, you can easily handle programming language like Python.
Before talking about Python let us know what is Data Analytics? Today, Data science is an attractive career option. Analytics is a blend of Big Data, statistical methods, and management decision making. Businesses are generating large amount of data as they are online now more than ever. Data comes in the form of text (opinion), number (satisfaction rating), voice messages, and videos (product reviews after delivery). To be ahead of competitors, businesses wish to analyze the data, make meaningful outcomes to take informed decisions.
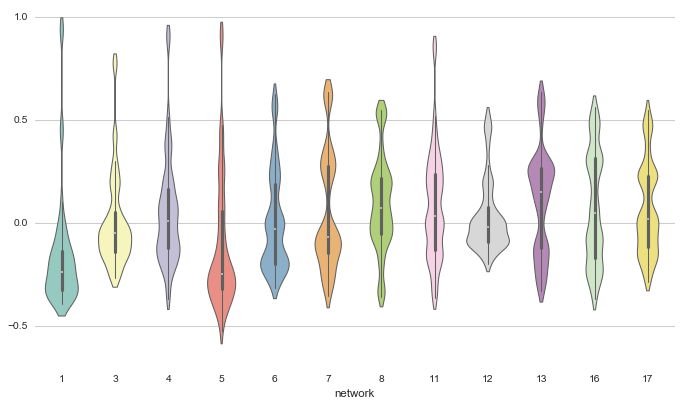
Let me introduce you with Python – Python is a production-ready computer programming language, this language is used in multiple operations. One of its tasks is data analytics but it is not specifically meant for data analysis. It’s an open-source language so you don’t need to pay anything, just download Anaconda and start working on Python. Python facilitates libraries, online communities, and a limited number of packages that are easy to use. Its best feature is the visualization of data. After using various software to make an eye candy chart I think, my search ends at Python. Yes, it’s a command-based programming language where you have to memorize commands or make a note to use them at the right time. Where Python is a winner or loser? It is the non-availability of GUI or Graphical User Interface like MS-Excel, SPSS, or SAS. But at the same time, it is a boon too. GIU limits the creativity of the user; the user will get only the features that are available with the software. But with Python, you can add features. Two examples of the charts are below-

At present, the software available in the market for the statistical calculations like R, MS-Excel, SPSS, SAS etc. All of them have some challenges and some benefits. If you will check vacancies in the top-paying jobs you will find
Today, there is varied software available in the market for statistical calculations like R, MS-Excel, SPSS, SAS, etc. All of them have some challenges and benefits. If you look at top-paying jobs you will find that companies are running behind Python. Let’s see how the other statistical packages fare in the race.
- R – R and Python are the most widely used statistical software in the field of data analytics. The reason for their popularity is they are open-source; one can download them, learn about them, and start working without paying a single penny. However, which one is better, and why? Let’s see –
- R is an academic tool specifically designed for statistical research only.
- For learners, Python and R are easy at the beginners’ level but when it comes to advanced functions, R becomes complex and is difficult to develop expertise. When you will shift from GUI based software to R or Python, initially it will seem daunting due to typing commands and no usage of mouse.
- R loses the race when it comes to visualization. Finding the right package for visualization can be a tedious task for a beginner as there are 2000 different packages. In Python, there are few packages like Seaborn, Bokeh, and Pygal that are easy to remember by a practitioner.
- MS-Excel – MS-Excel is software in the MS-office package developed by Microsoft Corporation. If you are known about the formulas in excel, Python will be easy for you. Because you can use mathematical, logical, and other operators while writing commands.
But still, Python wins the race.
- MS-Excel is paid but Python is free.
- MS-Excel is very easy to learn, but cannot handle data faster and easier.
- MS-Excel is not capable of advanced statistics, and machine learning.
- Detecting and fixing errors is a challenge in MS-Excel.
- In the case of advanced visualization, if you are stuck in MS-Excel there are no solutions available. Options of a community (a group of people online that help each other in solving issues) and libraries (data set on which you can practice and improve your problem-solving skills) help is not available for MS-Excel.
- SPSS – SPSS is a statistical package for the Social Sciences and is a popular product of IBM. It’s popularity is due to its GUI which is similar to MS-Excel.
- For learners purchasing SPSS is a costly affair, it disappoints aspirants who wish to learn data analysis using the software.
- Some other features that are lacking are non-availability of online communities and libraries.
- SPSS becomes slower when you are handling an extremely large data set.
- SAS – Statistical Analysis System or SAS developed by SAS Institute at North Carolina University. It is popular because it addresses the problems that MS-Excel and SPSS cannot handle. Due to its high safety ratings, banking and insurance companies prefer to use it. But, it is expensive software priced in India at INR 20 Lacs.
Of course, Python has not captured the complete analytics market but it is getting consideration. The reason is that we see mushrooming of startups in the area of web designing, e-commerce business, leading to increase in data usage, and its open-source availability. Students looking for a career in Data Science must keep Python in your quiver. It will be a useful tools that can enhance your job and career prospects.
For more information on Python-related readings follow my blogs on IILM Blog site https://blog.iilm.edu or write to me at ashutosh.singh@iilm.edu.